2026-10-05
What happened
I added scc to the deploy pipeline for Curiate so I could watch the codebase grow over time. scc counts lines of code, and if you leave it on its defaults it also prints a cost estimate at the bottom. This is what it printed:
Total                 531 files    81,674 lines    66,699 code
Estimated Cost to Develop (organic) $2,223,140
Estimated Schedule Effort (organic) 18.63 months
Estimated People Required (organic) 10.60
Curiate is one person and an AI coding agent, mostly at night, over seven months. That number seemed crazy, so I measured my side of it. The git history says about 150 hours. The agent's own session logs say 107 to 130. This post is the working: what scc counted, where the $2.2M comes from, what the project actually took, and why the two are about 200x apart.
Curiate is an art marketplace and gallery tool. It's a Go API, a Flutter app that ships to iOS and the web, and Postgres. It's live, it takes card payments through Square, it has a curator console for running shows, 39 database migrations, and nine tagged iOS builds. It is a real product, not a demo, which is what makes the comparison interesting.
What scc counted
| Language | Files | Code lines |
|---|---|---|
| Go | 143 | 24,738 |
| Dart | 149 | 24,239 |
| Markdown | 90 | 10,548 |
| Shell | 21 | 1,404 |
| JavaScript | 3 | 1,134 |
| HTML | 13 | 1,127 |
| SQL | 39 | 663 |
| Python | 4 | 647 |
| Everything else | 69 | 2,199 |
| Total | 531 | 66,699 |
"Code" here means non-blank, non-comment lines. Two things in that table matter later. Markdown is 16% of the total, because the repo holds its own specs, decision records and user docs, and scc counts them like anything else. And 10,850 lines are tests, another 16%.
Where $2.2M comes from
scc's estimate is Basic COCOMO in "organic" mode, a model Barry Boehm published in 1981 from 63 projects at TRW. It has exactly one input, thousands of lines of code:
effort   = 2.4 × KLOC^1.05      person-months
schedule = 2.5 × effort^0.38    months
people   = effort / schedule
cost     = effort × (salary / 12) × overhead
scc's defaults are a $56,286 salary and a 2.4x overhead multiplier. For 66,699 lines that works out to 197.5 person-months, which is about 30,000 hours of work, done by 10.6 people over 18.6 months.
Cleaning up the input doesn't rescue the number. My first thought was that counting Markdown and tests as code was inflating it. It is, but not by enough to matter:
| What gets counted | Lines | Person-months | Cost |
|---|---|---|---|
| Everything scc found | 66,699 | 198 | $2.22M |
| Without Markdown | 56,151 | 165 | $1.86M |
| Without Markdown or tests | 45,301 | 132 | $1.48M |
| Only shipped Go and Dart | 38,141 | 110 | $1.24M |
The strictest reading still says a seven-person team for fifteen months.
What it actually took
I estimated my hours from commit timestamps. Sort every commit by time, and split them into work sessions wherever the gap between two commits is longer than a threshold. A session is its last commit minus its first, plus a fixed lead-in for the work that happened before the first commit. The answer moves with both knobs, so here is the whole table rather than one number:
| Gap that ends a session | Lead-in | Sessions | Hours |
|---|---|---|---|
| 1 h | 30 min | 93 | 114 |
| 2 h | 30 min | 71 | 133 |
| 2 h | 60 min | 71 | 169 |
| 3 h | 60 min | 63 | 182 |
| 4 h | 60 min | 60 | 189 |
My baseline is a 2 hour gap and a 45 minute lead-in: 151 hours, in 71 sessions, on 46 different days, between February 24 and September 28. The longest session was 8.4 hours. Half of the 457 commits landed between 9pm and 3am.
The agent's logs are a second, independent clock. Claude Code keeps a local transcript of every session with a timestamp on every message. Clustering those the same way gives 107 hours with a 30 minute idle cutoff and 130 hours with a 60 minute one, across 43 days. The two instruments are wrong in different directions. Commits miss work that never got committed, and the transcripts count the agent working while I was away from the keyboard. They still land in the same place, so I'm comfortable saying 150 hours, give or take 40.
The same logs say what my side of those hours looked like: 978 prompts, with a median length of 57 characters. The agent's side was about 7,500 tool calls, 6.4 million output tokens, and 2.1 billion cached input tokens re-read across turns. At current API list prices that volume comes to roughly $1,700, which is the list value of the tokens and not a receipt. 433 of the 457 commits carry a Claude co-author line, across eight model versions from Sonnet 4.6 to Fable 5.1.
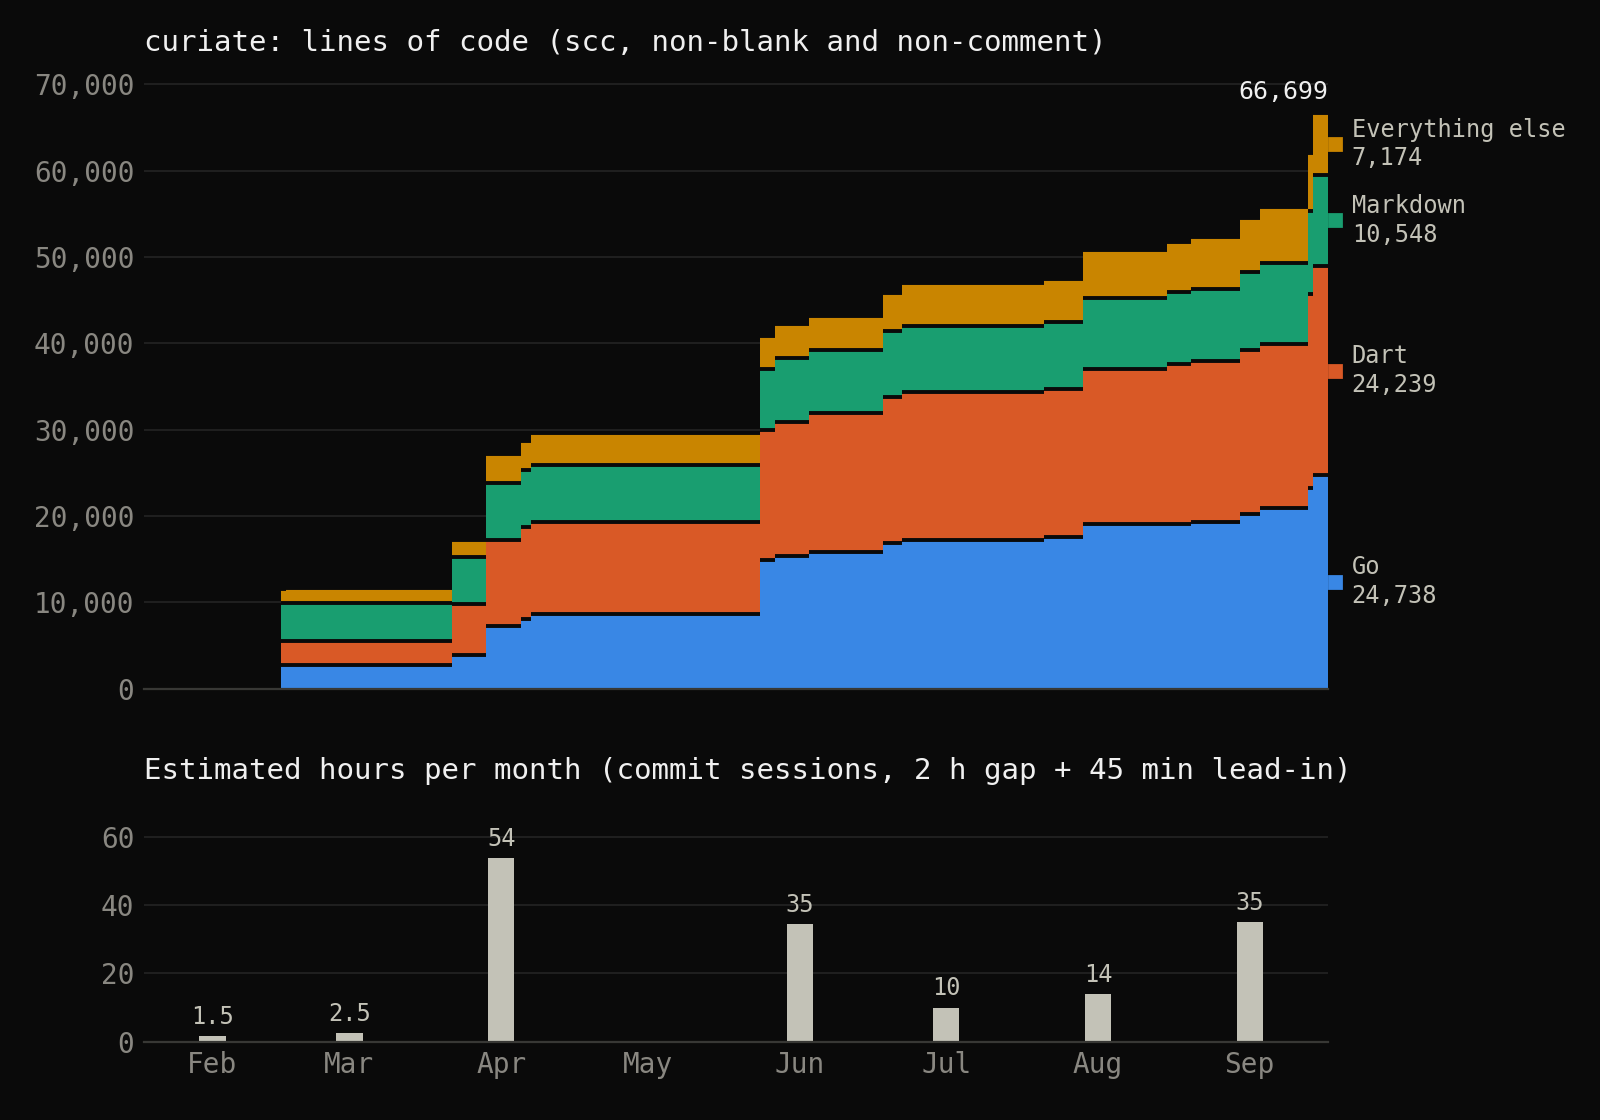
The top chart is the scc count at the last commit of each week. The bottom one is the hours estimate by month. Put together:
| Month | Hours | Net new code lines | Lines per hour |
|---|---|---|---|
| Feb–Mar | 4.0 | 11,639 at first count | |
| April | 53.8 | 17,978 | 334 |
| June | 34.5 | 13,566 | 393 |
| July | 10.0 | 3,820 | 382 |
| August | 14.0 | 4,796 | 343 |
| September | 35.0 | 14,900 | 426 |
The rate barely moves. Every month lands between 330 and 430 net lines per hour of my attention, through a sprint, two quiet months, and eight model versions. Newer models don't show up as a steeper line. My read is that the bottleneck was never the typing. It's how fast I can decide what to build, look at what came back, and say what's wrong with it.
The gap
| COCOMO | Measured | |
|---|---|---|
| Hours | 30,018 | about 150 |
| Calendar time | 18.6 months | 7 months, on 46 days of it |
| People | 10.6 | 1, plus an agent |
| Code lines per hour | 2.2 | about 440 |
| Cost at scc's own $74/hour | $2,223,140 | about $11,200, plus tokens |
The cost row uses scc's own assumptions on both sides: its salary and its overhead multiplier come to about $74 per loaded hour. At that rate my 151 hours are $11,200. Pick any rate you like for a senior contractor and the ratio doesn't change. It is 200 to 1.
COCOMO's 2.2 lines per hour is about 18 lines per person-day, which is the right neighborhood for the old rule of thumb that a developer on a team delivers tens of lines a day. So the model isn't broken on its own terms. It describes the world it was fitted to.
Why the model breaks
Lines of code were always a proxy, and the proxy stopped tracking the work. COCOMO doesn't think typing 66,000 lines takes 30,000 hours. It uses the line count to stand in for everything around the typing: requirements, design, meetings, integration, testing, rework, management. That worked when a line was expensive enough that nobody wrote one without all of that behind it. An agent writes lines for almost nothing, so the count now measures the agent's output, not the project's effort.
You can see it in what the repo is made of. A sixth of it is specs and docs, and another sixth is tests, because both are nearly free to ask for and they make the agent's next session better. Across the whole history, 92,087 lines were added and 8,676 were ever deleted. This codebase mostly accretes.
The model also charges for a team I don't have. The exponent above 1 and the ten-person headcount are coordination cost: the more code, the more people, the more time they spend keeping each other in sync. One person holding the whole design in their head, with an agent that re-reads the repo every session, pays almost none of that. Two billion cached tokens is what "re-reads the repo" looks like on the meter.
And 150 hours undercounts what went in. It doesn't include thinking done away from the keyboard, or testing on a device. It doesn't include the first commit, which arrived with 15,457 lines already in it (specs, a first backend and app, and Flutter's platform scaffolding) and gets credited 45 minutes. Most of all it doesn't include the years of building software that tell me what to ask for and what to reject. The agent made the typing free. It didn't make the judgment free.
It isn't the same product $2.2M would have bought, either. A ten-person team for a year and a half comes with a designer, QA, a security review, on-call, and someone whose job is to say no. Curiate has me and a test suite. For where it is, I think that's the right trade. It's still a different thing.
What I'm taking from it
I don't believe Curiate would have cost $2.2M before, and I can't prove what it would have cost, because nobody ran that experiment. What I can say is that the two numbers measure different things. One is what 66,000 lines used to imply about the organization behind them. The other is what it took to get a working product.
- Stop reading line counts as effort. I'm keeping scc in the pipeline for the growth curve, with the cost estimate turned off (
--no-cocomo). The curve is useful. The dollar figure is noise. - Track attention instead. Hours, sessions and prompts are the scarce inputs now, and they were easy to recover after the fact from data I already had.
- Watch the lines-per-hour rate. It was flat for six months. If it ever climbs, the interesting question is whether I'm deciding faster or just reviewing less.
Making it repeatable
One project is an anecdote, so I turned the measurement into a tool. It's a Claude Code skill I'm calling effort-ledger. One script runs the same four instruments with the same settings on any repo: scc size, the COCOMO figure for that size, hours from commit sessions, and hours, prompts and tokens from the agent's transcripts. Each run is appended to a ledger so projects can be put side by side. Every number in this post comes from it. Here are four of my projects on the same ruler:
| Project | Product lines | Hours (range) | Lines per hour | COCOMO ÷ measured | Tokens at list |
|---|---|---|---|---|---|
| Curiate | 44,339 | 151 (114–189) | 293 | 199x | $1,705 |
| This site | 3,583 | 26 (19–34) | 138 | 385x | $23 |
| circuit‑decimator | 13,178 | 10 (6–14) | 1,292 | 837x | $186 |
| A private tool | 3,589 | 34 (24–46) | 106 | 70x | $374 |
"Product lines" leaves out docs, tests and config, which is the least misleading size I've found, and the per-hour rate uses it. The COCOMO ratio still uses everything scc counts, the way scc does.
The spread is the lesson. The gap runs from 70x to 837x, and most of that spread says more about the ruler than about the projects. This site scores 385x because COCOMO prices 13,000 lines of blog posts as software. circuit-decimator is an audio plugin, and its 1,292 lines per hour is five days of work on a repo whose first commit already held 14% of the code, which is too little data to mean anything. None of these rows is a productivity number. The whole exercise is a little fake, and I'd rather have a table that shows it than a single figure that hides it. What the ledger gives me is the same proxies, taken the same way, every time.
Building the tool also corrected this post. My first pass was done by hand, and it had three wrong numbers in it:
- 15 extra commits.
git log --allpicked up a branch that a CI bot appends to. The hours didn't change, but the commit count did. - About 500 extra prompts. A memory hook spawns a headless agent session after every real one. Those were 520 of the transcripts in the project folder, against 14 long-running sessions where I was actually at the keyboard.
- $2,100 on scc's cost line. Three untracked scripts were sitting in the working tree. The tool measures the committed tree instead.
None of them changed the conclusion, and all three would have gone out in print. That's the argument for a fixed ruler.
How I measured
scc4.1.0 on the committed tree, excluding lock files, generated files and rendered docs.- Hours: a short Python script over
git log --format=%at, session clustering as described above. - Session time, prompts and tokens: the timestamps and usage fields in Claude Code's local transcripts for this project. Only interactive sessions count. A memory hook spawns a headless session after each real one, and those 520 transcripts are left out of the hours and prompts (they add about $100 of tokens at list).
- All of it runs from one script with two commands,
measureandcompare, so the next project gets exactly the same treatment. - Everything is one repo. Curiate's backend, app, migrations, docs and infrastructure scripts all live in it, so there's no second repo hiding hours.
The sensitivity table is the honest version of the hours number. Anyone who wants 114 or 189 instead of 151 can have it, and the conclusion is the same at either end.